All I wanted was a Light Organ
2015 08 31
It all started with my Outside LED Deck Lighting Project — I wanted to drive the lights based on the music that was playing.
Six years later, I am pleased to report progress :-)

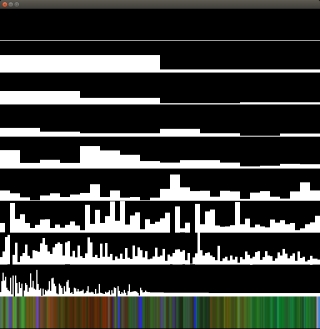
First, let me describe the picture above. There are 9 bands of black and white graphics, with one colour band at the bottom. The 9 bands of black and white represent 9 octaves worth of frequency data, and the colour band on the bottom represents a synthesized “colour organ” output.
Let's talk about FFT's first. If you take a stock FFT, like the one in Numerical Recipes in C, for example, you get a complex output. Converting this to magnitude is simple — you take the square root of the sum of the products of each component. (Effectively, you're using the Pythagorean theorem to find the hypotenuse.)
But what you end up with confuses most amateurs — it certainly confused me. The trick is, each X axis value represents one frequency.
I like practical, so let's use some real numbers. I sample audio at 44100 Hz, and I use a 1024 point FFT. On the input side, I populate 1024 complex numbers (I fill the value in the real part, and leave the imaginary part as zero).
I then run the magical FFT algorithm.
It spits out an array with 1024 complex samples. There are a couple of things to note:
- the samples are mirrored (you can ignore the second batch of 512)
- the outputs are complex (but can be converted to magnitude easily)
- the samples each represent a frequency band of 43 Hz.
How did I arrive at 43Hz?
My sampling frequency is 44100, and I have 1024 samples in the output. 44100 ÷ 1024 = 43.06640625.
Music, however, is concerned with “octaves.” An octave is a series of notes where the first note is half the frequency of the final note (or the final note is double the frequency of the first note. Potato, potato).
The very first output bin is the DC component, and we ignore it. The second output bin is the 43 Hz bin. The third output bin is the 86 Hz bin, followed by the 129, 172, 215, 258, 301, 344, and so on frequency bins.
Converting this to octaves, though, means that the first octave is 43 → 86 Hz. The second octave is 86 → 172, the third is 172 → 344, then 344 → 688, and so on, doubling each time.
Practically, this means that there are twice as many samples in each octave as the one before. That is why the picture above looked a little odd (it did, didn't it?) The first band had just a horizontal line (one line only). The second band had two bars, one about 2/3rds of the way up, and one pretty much near the bottom. The third band had four bars, the fourth had eight, the fifth had sixteen, and so on.
This means that if you look at a given X value, you can see the note and all of its octave harmonics.
What about the colour organ?
So, given all this, what about the colour organ?
That turned out to be the simplest part. Given the 9 octave bands (normalized to each contain approximately the same energy per octave), I simply took the sum of the first three and called it red, the next three were green, and the last three were blue.
So what you see in the bottom colour part of the picture is a scrolling colour organ value. The reds indicate lots of low notes, the greens indicate lots of medium notes, and the blues represent lots of high notes. Of course, combinations of notes give combinations of colour.
Final Integration
2015 09 02
Final integration consisted of taking the R, G, and B outputs and writing them to a scratchpad (see my article, A Simple Scratchpad in Shared Memory), where the RGB light controller reads the values and writes them to the hardware.